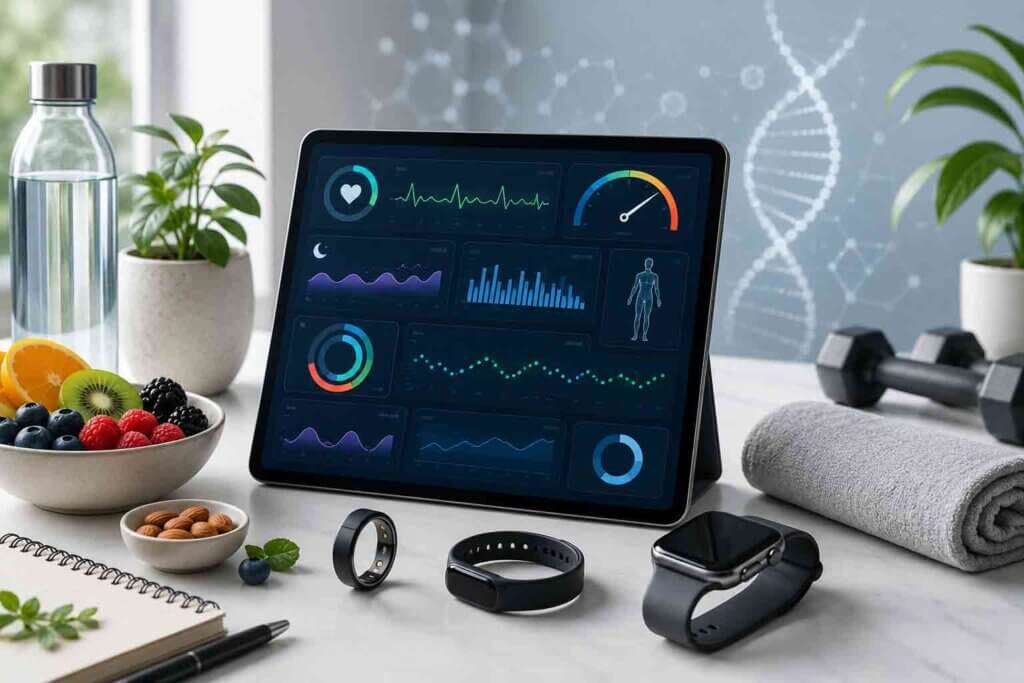
A smartwatch can now hand you a “readiness score,” a “recovery score,” a “wellness score,” and a “vitality age” before you’ve finished your morning coffee. Most of these numbers are proprietary blends that no outside researcher has ever validated against a hard outcome like death. That is the uncomfortable gap at the center of the quantified-self movement: dashboards are everywhere, but very few of the numbers on them have ever been tested against the only endpoint that settles arguments in longevity science.
This matters because a dashboard built on the wrong metrics does something worse than nothing. It gives you false confidence. You watch a “sleep score” climb while your actual sleep architecture stays broken, or you chase a step count while ignoring a grip strength that’s quietly predicting your risk of an early death better than your cholesterol panel ever could.
The good news is that a small set of metrics have decades of prospective cohort data — sometimes covering millions of participants — linking them directly to all-cause mortality, cardiovascular disease, and functional decline. This guide walks through the metrics with that kind of evidence behind them, explains how to actually track each one, and shows how to assemble them into a dashboard that reflects reality.
Cardiorespiratory Fitness (VO2 Max): The Strongest Single Predictor We Have
If a personal longevity dashboard has room for only one number, the evidence points squarely at VO2 max — the maximum rate at which your body can consume oxygen during intense exercise.
A 2024 umbrella review in the British Journal of Sports Medicine pooled 199 cohort studies representing more than 20.9 million observations and found cardiorespiratory fitness to be a consistent, strong predictor of mortality and a wide range of chronic diseases. That scale of evidence is rare in any field of medicine.
The mechanism shows up clearly in dose-response data. Research published in JAMA has found that every 1-MET increase in fitness (roughly 3.5 ml/kg/min of VO2 max) is associated with a 13 to 15 percent reduction in mortality risk. A 2018 Cleveland Clinic analysis of more than 122,000 adults undergoing treadmill testing, published in JAMA Network Open, found that people with the lowest fitness levels had roughly five times the mortality risk of those in the “elite” category, and unlike almost every other cardiovascular risk factor, the fitness curve showed no upper limit where more fitness stopped helping.
For context on how VO2 max stacks up against other well-known risks, physician and longevity researcher Peter Attia has pointed out that the mortality gap between low and elite fitness in that dataset was larger than the gap associated with smoking, coronary artery disease, or type 2 diabetes.
How to track it: A lab-based cardiopulmonary exercise test (CPET) remains the gold standard, but it’s expensive and not something most people repeat often. Consumer wearables, including recent Apple Watch models, now estimate VO2 max from heart rate and pace data during outdoor walks or runs. A 2025 validation study comparing Apple Watch estimates against indirect calorimetry found the wearable estimates track reasonably well for general trend purposes, though they shouldn’t replace clinical testing if you need a precise number. For a dashboard, the trend line over months matters more than the absolute figure on any single day.
Grip Strength: A Five-Second Test With Decades of Mortality Data
Grip strength looks like a strange thing to put on a longevity dashboard next to VO2 max and blood biomarkers, but it has one of the deepest evidence bases in aging research, largely because it’s cheap enough that huge population studies have measured it for decades.
A meta-analysis covering 42 studies and more than 3 million participants found that for every 5-kilogram drop in grip strength, all-cause mortality risk rose by roughly 16 percent. The landmark PURE study, published in The Lancet and following nearly 140,000 people across 17 countries, reported that grip strength predicted all-cause and cardiovascular mortality more strongly than systolic blood pressure — a genuinely surprising finding, since blood pressure is treated as a pillar of cardiovascular risk assessment.
Grip strength works as a proxy for something broader: overall skeletal muscle quality and neuromuscular function, both of which decline with age and both of which are tied to frailty, falls, and loss of independence. A UK Biobank analysis covering roughly half a million participants confirmed the association held for cardiovascular disease, respiratory outcomes, and cancer-related mortality, not just heart-related death.
The trend matters as much as the single number. A study of adults 85 and older found that those whose grip strength kept improving over a five-year period had a 31 percent lower mortality risk than those with a stable trajectory, while those in decline saw meaningfully higher risk with every additional kilogram lost per year.
How to track it: A hand dynamometer costs less than a decent yoga mat and takes thirty seconds to use. Test your dominant hand three times, record the best result, and repeat quarterly. Resistance training that targets grip, back, and leg strength is the most direct lever for moving this number.
Heart Rate Variability and Resting Heart Rate: Autonomic Signals Worth Watching
Heart rate variability, the beat-to-beat variation in the time between heartbeats, has become one of the most heavily marketed wearable metrics, and for once the underlying science holds up reasonably well, with an important caveat about consistency.
HRV reflects the balance between the sympathetic and parasympathetic nervous systems. Lower HRV has repeatedly been associated with elevated cardiovascular risk and mortality in population studies. A 2025 analysis across five longitudinal studies using consumer wearables — smartwatches, chest straps, and smart rings — found that resting HRV measured upon waking or during sleep showed small-to-moderate associations with slower-changing health measures like average blood glucose and sleep difficulty, though same-day associations with stress and mood were less consistent.
That distinction matters for dashboard design. HRV is a noisy, highly individual metric that reacts to alcohol, illness, travel, and training load. The researchers behind that 2025 analysis specifically flagged nighttime and morning resting HRV as the more meaningful readings, since they strip out the confounding effect of daytime activity.
Resting heart rate is the simpler, older cousin of HRV and remains one of the most consistently reproduced predictors of cardiovascular risk across decades of research. A lower resting heart rate generally reflects better cardiovascular efficiency, though extremely low values in non-athletes can sometimes flag a separate problem worth discussing with a physician.
How to track it: Don’t obsess over any single night’s HRV reading. Track a rolling 7-day and 30-day average instead, and watch for sustained deviations from your personal baseline rather than day-to-day noise. Most wrist and ring wearables now surface both metrics automatically.
Sleep: The Metric With the Clearest Dose-Response Curve
Sleep might be the most consistently misread metric on consumer dashboards, because “sleep score” algorithms vary wildly between brands while the underlying research on sleep duration and mortality is unusually consistent.
A 2025 meta-analysis of 79 cohort studies found that sleeping less than seven hours a night was associated with a 14 percent higher mortality risk compared with the 7-to-8-hour reference range, while sleeping nine or more hours was associated with a 34 percent higher risk. Multiple independent meta-analyses, including a dose-response analysis published in the Journal of the American Heart Association, have found the same U-shaped or J-shaped pattern, with risk bottoming out around seven hours per night.
UK Biobank data using objective actigraphy, rather than self-reported sleep, found that people sleeping five hours a night had a 29 percent higher mortality risk than seven-hour sleepers, and that both early and late sleep timing independently raised risk — a finding that suggests consistency of sleep timing may matter almost as much as total duration.
The long-sleep side of the curve is trickier to interpret. Extended sleep durations often reflect underlying illness or inflammation rather than causing harm directly, so a dashboard reading of consistently long sleep is more useful as a prompt to investigate other health markers than as a standalone red flag.
How to track it: Total sleep duration and sleep timing consistency are the two numbers with the strongest evidence behind them. Proprietary “sleep scores” can be useful for spotting personal trends, but treat the underlying duration and bedtime-consistency data as the primary signal, and be skeptical of any score that swings wildly night to night without an obvious cause.
Body Composition and Metabolic Markers: The Blood Panel Foundation
Wearables are good at movement and sleep, but they can’t see inside your bloodstream, which is why a longevity dashboard still needs a periodic lab panel layered underneath the daily data.
The markers with the deepest evidence base include fasting glucose and HbA1c (a marker of average blood sugar over roughly three months), a standard lipid panel, high-sensitivity C-reactive protein as a marker of systemic inflammation, and waist-to-height ratio as a simple, well-validated proxy for visceral fat that outperforms BMI at flagging metabolic risk in many population studies. None of these require exotic testing; they’re the same markers most primary care physicians already order, which is part of why they remain the backbone of serious biological age models.
This is also where the “blood biomarker panel” approach to biological age testing lives. A 2026 comparison of biological age testing methods described blood biomarker panels as offering the fastest feedback loop of any aging measurement approach, since results can shift within weeks to months of a genuine lifestyle change, making them useful for iterating on a dashboard in near real time rather than waiting years to see a signal.
How to track it: A comprehensive panel once or twice a year is enough for most people; quarterly testing makes sense only if you’re actively intervening on a specific marker and want to confirm it’s moving. Log absolute values rather than relying on a single composite “score,” since the individual markers each carry their own separate evidence base and can move in different directions.
Biological Age Tests: Powerful, but Read the Fine Print
Epigenetic clocks — tests that estimate biological age from patterns of DNA methylation — have become the most talked-about entrants in the personal longevity dashboard space, and the science behind the newest generation is genuinely strong, even if the marketing around consumer versions frequently overstates what a single result can tell you.
Third-generation “mortality clocks” like GrimAge2 and the pace-of-aging measure DunedinPACE currently have the strongest validation record. A 2025 retrospective cohort study using NHANES data found that GrimAge and GrimAge2 age acceleration were significantly associated with all-cause, cancer-specific, and cardiac mortality, making them the only clocks among eleven tested to show that association across all three outcomes simultaneously. GrimAge2 also builds in DNA methylation surrogates for inflammatory and metabolic markers like C-reactive protein and HbA1c, which strengthens its connection to real disease pathways rather than chronological age alone.
The caveats are worth taking seriously before this metric earns a permanent spot on a dashboard. No consumer biological age test currently carries FDA clearance. A 2025 review in Frontiers in Molecular Biosciences highlighted ongoing reproducibility concerns across labs and platforms, and researchers at recent National Institute on Aging symposiums have cautioned that shifting a proxy measurement — the methylation pattern — is not proof that you’ve changed the underlying biological aging process it’s meant to represent.
How to track it: Treat a single epigenetic age result as a range, not a verdict, and retest annually rather than quarterly, since short-term factors like illness or acute stress can shift some clock outputs. If you’re choosing one clock, the current evidence favors GrimAge2 or DunedinPACE over older, chronological-age-focused clocks like the original Horvath model, and over telomere length, which most current comparisons rank as the weakest of the major biological age methods.
Putting It Together: A Dashboard Framework That Reflects the Evidence
Once you strip out the vanity metrics, a genuinely evidence-based longevity dashboard has a fairly small footprint. Organize it into three tiers based on how often the underlying biology actually changes.
Daily or automatic (wearable-driven): resting heart rate and HRV trend, sleep duration and timing consistency, step count or general activity as a rough proxy for the physical activity linked to lower mortality in nearly every cohort study on the topic.
Quarterly (manual, five minutes): grip strength via dynamometer, VO2 max estimate from a structured cardio session, waist-to-height ratio with a tape measure.
Annual (clinical): a comprehensive blood panel covering glucose, lipids, and inflammatory markers, plus an epigenetic age test if you want the deepest signal and can accept the current uncertainty range around any single result.
The point of separating these tiers isn’t just organizational tidiness. It matches how frequently each metric can genuinely move. Checking your HRV daily is reasonable because it does fluctuate daily. Checking your biological age monthly is a waste of money and will mostly measure test-to-test noise rather than real biological change.
Frequently Asked Questions
Which single metric best predicts longevity?
Cardiorespiratory fitness, measured as VO2 max, currently has the largest and most consistent body of evidence linking it to all-cause mortality, based on an umbrella review of nearly 200 cohort studies covering over 20.9 million observations.
Is a smartwatch VO2 max estimate accurate enough to trust?
Validation research comparing wearable estimates to lab-based indirect calorimetry has found reasonable agreement for tracking personal trends over time, though the estimates carry more error than a supervised cardiopulmonary exercise test and shouldn’t be treated as a precise clinical number.
Are biological age tests worth paying for?
Third-generation epigenetic clocks like GrimAge2 and DunedinPACE have real mortality-prediction evidence behind them, but no consumer version has FDA clearance and results should be treated as a range rather than a fixed number, with annual retesting rather than frequent repeat testing.
How much sleep actually minimizes mortality risk?
Multiple large meta-analyses converge on roughly seven hours per night as the point of lowest risk, with both shorter and longer average sleep durations associated with elevated all-cause mortality.
The Bottom Line
A longevity dashboard is only as good as the evidence behind the numbers on it. VO2 max, grip strength, resting HRV trends, sleep duration and timing, core metabolic blood markers, and — with appropriate caveats — a validated epigenetic clock together cover the metrics with the strongest links to actual survival and functional health, not just proprietary scores designed to keep you opening an app. Build the dashboard around those, check each metric on a schedule that matches how fast it can realistically change, and you’ll have a system that tells you something true about your trajectory instead of just something that feels satisfying to look at.
Sources
- Lang, J.J., Prince, S.A., Merucci, K., et al. “Cardiorespiratory fitness is a strong and consistent predictor of morbidity and mortality among adults: an overview of meta-analyses representing over 20.9 million observations.” British Journal of Sports Medicine, 2024. https://bjsm.bmj.com
- Mandsager, K., Harb, S., Cremer, P., et al. “Association of Cardiorespiratory Fitness With Long-term Mortality Among Adults Undergoing Exercise Treadmill Testing.” JAMA Network Open, 2018. https://jamanetwork.com/journals/jamanetworkopen/fullarticle/2707428
- Kodama, S., Saito, K., Tanaka, S., et al. “Cardiorespiratory Fitness as a Quantitative Predictor of All-Cause Mortality and Cardiovascular Events in Healthy Men and Women: A Meta-analysis.” JAMA, 2009. https://jamanetwork.com/journals/jama/fullarticle/184300
- Peter Attia MD. “How does VO2 max correlate with longevity?” https://peterattiamd.com/how-does-vo2-max-correlate-with-longevity/
- “Investigating the accuracy of Apple Watch VO2 max measurements: A validation study.” PMC, 2025. https://www.ncbi.nlm.nih.gov/pmc/articles/PMC12080799/
- “Association of Grip Strength With Risk of All-Cause Mortality, Cardiovascular Diseases, and Cancer in Community-Dwelling Populations: A Meta-analysis of Prospective Cohort Studies.” PubMed, 2017. https://pubmed.ncbi.nlm.nih.gov/28549705/
- Leong, D.P., et al. “Prognostic value of grip strength: findings from the Prospective Urban Rural Epidemiology (PURE) study.” The Lancet, 2015. https://www.thelancet.com/journals/lancet/article/PIIS0140-6736(14)62000-6/abstract
- “Grip Strength: An Indispensable Biomarker For Older Adults.” PMC. https://pmc.ncbi.nlm.nih.gov/articles/PMC6778477/
- “Initial level and rate of change in grip strength predict all-cause mortality in very old adults.” Newcastle 85+ Study, PMC. https://www.ncbi.nlm.nih.gov/pmc/articles/PMC5860048/
- “Resting Heart Rate Variability Measured by Consumer Wearables and Its Associations with Diverse Health Domains in Five Longitudinal Studies.” PMC, 2025. https://pmc.ncbi.nlm.nih.gov/articles/PMC12693838/
- “Imbalanced sleep increases mortality risk by 14–34%: a meta-analysis.” GeroScience / PMC, 2025. https://pmc.ncbi.nlm.nih.gov/articles/PMC12181477/
- “Relationship of Sleep Duration With All‐Cause Mortality and Cardiovascular Events: A Systematic Review and Dose‐Response Meta‐Analysis of Prospective Cohort Studies.” Journal of the American Heart Association. https://www.ahajournals.org/doi/10.1161/JAHA.117.005947
- Nature Index. “Sleep Duration and Mortality Risk Association” (UK Biobank actigraphy findings). https://www.nature.com/nature-index/topics/l4/sleep-duration-and-mortality-risk-association
- “Biological Age Test: 5 Methods Compared by Accuracy & Actionability.” MitoHealth, 2026. https://mitohealth.com/guide/biological-age-testing
- “Biological Age Tests: What Blood Tests Actually Show.” Medical News Today, 2026. https://medicalnewstoday.us/biological-age-tests/
- Zhu, T., He, Y., Wang, Y., Zhao, L. “GrimAge and GrimAge2 Age Acceleration effectively predict mortality risk: a retrospective cohort study.” Epigenetics, 2025. https://www.ncbi.nlm.nih.gov/pmc/articles/PMC12269703/
- “From the lab to lifestyle: epigenetic clocks in personalized aging and health.” Biogerontology, Springer Nature, 2026. https://link.springer.com/article/10.1007/s10522-026-10447-8